Author: Francisco Cuenca-Fernández
Introduction and methodology
The swimming start is the technique used by swimmers to propel themselves as quickly as possible before starting the swim. In 50m events, starting in a delayed position can be an insurmountable barrier to overcome in the rest of the distance, therefore, this gesture can be one of the most relevant factors in the final result, as the differences here can be greater than the differences in the total time (Arellano et al., 2018; Morais et al., 2019; Olstad et al., 2020; Veiga & Roig, 2017).
Specifically in the breaststroke, it is important to note that, unlike the 15m length limit set for the underwater section of the other three strokes (Mason et al., 2001), the restrictions in the breaststroke are to: i) glide with a single dolphin kick in a hydrodynamic position; ii) perform a single pull with the upper limbs, and; iii) surface with the head before the hands turn inwards on the initiating part of the stroke (Seifert et al., 2007).
In this sense, the optimisation of this gesture is fundamental to obtain maximum speed. Therefore, the aim of the present study was to evaluate the influence of the breaststroke start phase in the 50 and 100 m in short pool (Sánchez et al., 2021). These data were obtained at the National Short Course Swimming Championships – 2019 held in Gijón (Spain) using two video cameras (Sony 4 K, 1080p 50 Hz) placed at the top of the pool stands. In 50 m breaststroke 108 races were analysed (61 men and 47 women), while in 100 m 126 races were analysed (71 men and 55 women). The following variables were collected:
-T15: Time to 15m (s).
-V15: Velocity to 15m (m-s-1).
-ET: Emersion time after the start (s).
-ED: Emersion distance after the start (m).
-VE: Emersion velocity after the start (m-s-1).
Results and discussion
Pearson product-moment correlation coefficients (r) between all variables and final time were obtained and simple linear regression analyses were applied to assess possible associations between T15 and final time.
| Variables | Male 50m | Female 50m | Male 100m | Female 100m | ||||
| Mean ± SD | r | Mean ± SD | r | Mean ± SD | r | Mean ± SD | r | |
| Final Time | 29.07 ± 0.97 | 33.01 ± 1.15 | 63.55 ± 2.07 | 71.70 ± 2.66 | ||||
| T15 | 6.51 ± 0.39 | .915** | 7.64 ± 0.28 | .826** | 6.72 ± 0.37 | .788** | 7.81 ± 0.36 | .769** |
| V15 | 2.31 ± 0.14 | -.915** | 1.96 ± 0.07 | -.822** | 2.23 ± 0.12 | -.789** | 1.92 ± 0.09 | -.772** |
| ET | 4.72 ± 5.25 | -.117 | 4.97 ± 0.55 | -.006 | 5.32 ± 0.48 | .062 | 5.30 ± 0.64 | .038 |
| ED | 12.50 ± 0.92 | -.649** | 11.48 ± 1.03 | -.329* | 13.37 ± 1.28 | -.269* | 12.20 ± 1.20 | -.278* |
| VE | 2.64 ± 0.15 | -.643** | 2.31 ± 0.15 | -.441** | 2.51 ± 0.21 | -.355** | 2.30 ± 0.12 | -.572** |
Table 1. Mean ± standard deviation (SD) and Pearson correlation coefficients (r) of the variables collected in 50 and 100 m breaststroke (* p < 0.05; ** p < 0.01).
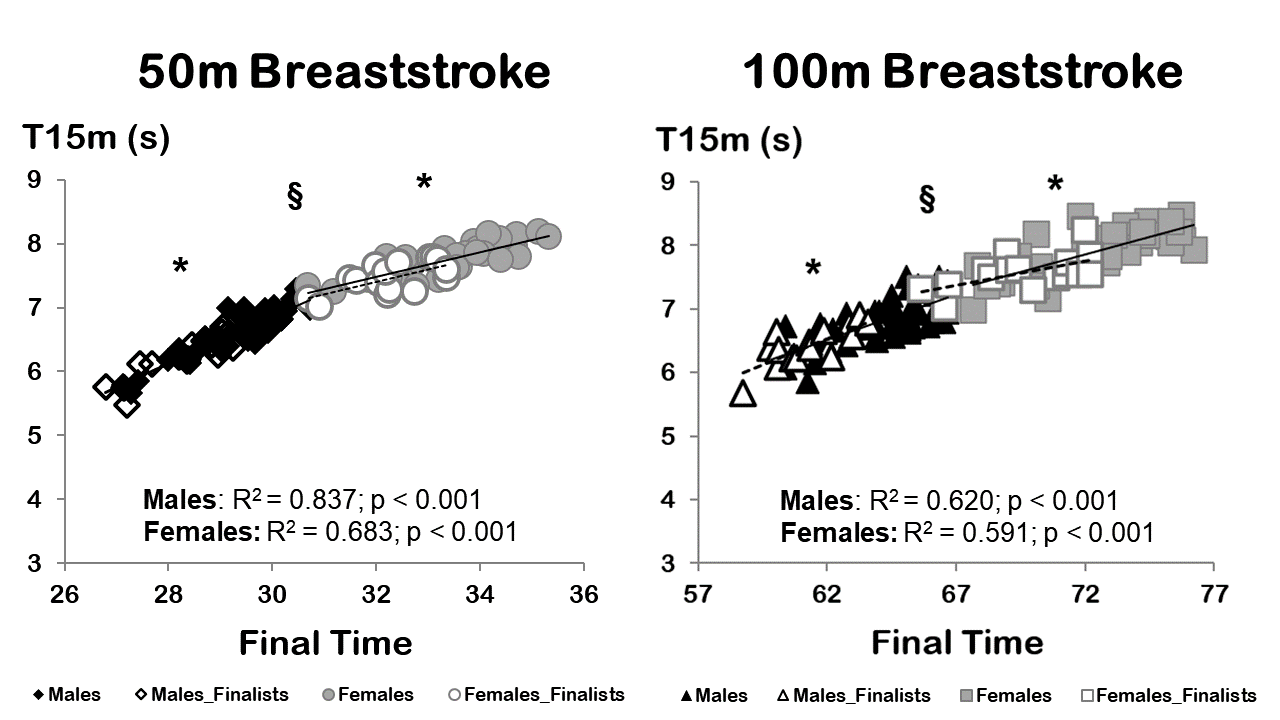
Figure 1. Linear regressions between final time and underwater variables in 50m and 100m breaststroke. Data grouped by gender (men and women [§ = p < 0.05]) and outcome (finalists and non-finishers [* = p < 0.05]).
In addition, the partial contribution (%) of the variables was obtained to assess their relative influence on the final time.
| Partial contribution (%) to 50m | Partial contribution (%) to 100m | |||||
| Male ~ Female | P-value | Male ~ Female | P-value | |||
| T15 | 22.40 ± 0.73% | 23.17 ± 0.50% | 0.001 | 10.58 ± 0.38% | 10.90 ± 0.33% | 0.001 |
| ET | 16.28 ± 1.37% | 15.07 ± 1.75% | 0.001 | 8.39 ± 0.79% | 7.42 ± 0.92% | 0.001 |
Table 2. Mean ± standard deviation and effect size of the partial contribution (%) obtained for men and women by Time to 15m, Emersion Time and Turning Time to the final time in 50m and 100m breaststroke.
A low T15 and high V15 were associated with a lower final time in both genders and events, suggesting that faster swimmers have better starts. Values were better in 50m, and in men compared to women (Figure 1). Thus, the requirements of this phase seem to play in favour of higher levels of maximal and explosive strength in men compared to women (Nowacka and Słomiński, 2018; West et al., 2011). Therefore, a good kinematic organisation together with a good development of muscle function should be integrated elements in training plans to optimise the performance of this skill (Cuenca-Fernández et al., 2015).
The emersion time did not seem to be relevant for the final performance (Table 1). This lack of correlation could be explained by the fact that it may depend on the swimmer’s choice, meaning that some may finish earlier and others later for the same purpose of maintaining a high speed. Some studies have claimed that better swimmers achieve longer times and distances in the underwater phases compared to non-experts (Mason et al., 2001; Veiga et al., 2016). In this study, only male 50m finalists achieved greater distances than non-finalists (Figure 1). However, emersion distances at 100m (13.37 – 12.20 m) were greater than at 50m (12.50 – 11.48 m), yet lower emersion velocities were obtained at 100m (Table 1). Therefore, it seems unlikely that greater distances and higher velocities can be achieved at the same time.
The relative influence of the start phase to the 50m final time was considerable (~22-23%). For the 100m, the partial contribution of the start phase (~10%) is in agreement with the ~11% reported by Morais et al. (2019) and Olstad et al. (2020) in long and short course. The low correlations between ET and final time (r = -0.26, -0.27), were similar to those obtained by Veiga et al. (2016) in long course (r = -0.17, -0.27) and seem to corroborate that swimmers maximise start distances only when a net speed gain is likely (Morais et al., 2019; Veiga et al., 2016). Therefore, achieving high speed during emersion should be the main goal to improve the exit phase.
Applications for coaches:
Estimating race segments with fixed distances is widely accepted (i.e., using the 15m mark to define the start phase) since it allows easy comparison between swimmers. However, this does not accurately represent the swimmer’s actual speed during the underwater phase. For example, short fixed distances after the start and turns (e.g., 5 m) could erroneously show that the tallest swimmers reach these marks earlier without necessarily being the fastest. For this reason, both values relative to each swimmer’s emersion (VE) and values relative to a fixed distance such as V15 should be considered.
Extended version of the study:
Sánchez, L., Arellano, R., & Cuenca-Fernández, F. (2021). Analysis and influence of the underwater phase of breaststroke on short-course 50 and 100m performance. International Journal of Performance Analysis in Sport, 1-17. Doi:10.1080/24748668.2021.1885838
Acknowledgements
This study was supported by the Spanish Research Agency and the European Regional Development Fund (ERDF) under grant: PGC2018-102116-B-I00 “SWIM II: Water-specific innovative measures: applied to performance improvement”.
References
Arellano, R., Ruiz-Teba, A., Morales-Ortiz, E., Gay, A., Cuenca-Ferández, F., Llorente-Ferrón, F., & López-Contreras, G. (2018). Short course 50m male freestyle performance comparison between national and regional spanish swimmers. ISBS Proceedings Archive, 36(1), 614-617.
Cuenca-Fernández, F., Taladriz, S., López-Contreras, G., de la de la Fuente, B., Argüelles, J., & Arellano, R. (2015). Relative force and PAP in swimming start performance. (Ed.),^(Eds.). ISBS-Conference Proceedings Archive.
Mason, B., & Cossor, J. (2001). Swim start performances at the Sydney 2000 Olympic Games. (Ed.),^(Eds.). ISBS-Conference Proceedings Archive.
Morais, J. E., Marinho, D. A., Arellano, R., & Barbosa, T. M. (2019). Start and turn performances of elite sprinters at the 2016 European Championships in swimming. Sports Biomechanics, 18(1), 100-114.
Nowacka, A., & Słomiński, P. (2018). Swimming–an analysis of age and somatic profile of finalists and medalists in rio de Janeiro 2016. SWIMMING VII, 84.
Olstad, B. H., Wathne, H., & Gonjo, T. (2020). Key Factors Related to Short Course 100 m Breaststroke Performance. International Journal of Environmental Research and Public Health, 17(17), 6257.
Seifert, L., Vantorre, J., & Chollet, D. (2007). Biomechanical analysis of the breaststroke start. International Journal of Sports Medicine, 28(11), 970-976.
Veiga, S., Roig, A., & Gómez-Ruano, M. A. (2016). Do faster swimmers spend longer underwater than slower swimmers at World Championships? European journal of sport science, 16(8), 919-926.
Veiga, S., & Roig, A. (2017). Effect of the starting and turning performances on the subsequent swimming parameters of elite swimmers. Sports Biomechanics, 16(1), 34-44.
West, D. J., Owen, N. J., Cunningham, D. J., Cook, C. J., & Kilduff, L. P. (2011). Strength and power predictors of swimming starts in international sprint swimmers. The Journal of Strength & Conditioning Research, 25(4), 950-955.
Leave a Reply